
Say you’re interested in Amazon (AMZN) in the US or Royal Bank of Canada (RY.TO or RY) in Canada or Hindustan Unilever Ltd. (HINDUNILVR.NS or HUL) in India. We’ll take a first and quick look at some financial information about these stocks.
In the US you can go to Yahoo Finance, in Canada you can go to Yahoo Finance Canada, and in India you can go to Yahoo Finance India. In the Search box where it says “Search for news, symbols or companies“, type the symbol of the company (in brackets above) or the name of the company and hit Search.
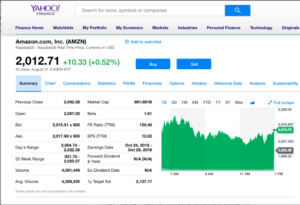
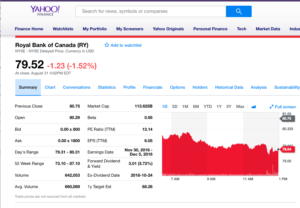
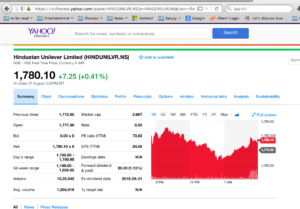
You’ll be presented with the below financial information of the company, along with the current stock price or the last closing price in case the markets are closed when you’re doing this search.
Here is what I got for each of the three companies:
Let’s start understanding the numbers and ratios that are presented.
Qualitative Information
- Market Cap: This is the market capitalization of the company, or the total value of the company. Market capitalization = Number of shares outstanding x Price of each share. Depending on the number of shares outstanding and the fluctuation in the share price, the market capitalization fluctuates accordingly. The market cap tells you whether this is a Large Cap, Medium Cap, or Small Cap company. Large cap companies are considered more stable and less volatile, whereas Small cap companies are considered less stable and more volatile.
- Beta: Beta is a measure of a stock’s volatility (or risk) in relation to the market. What does that mean, you ask :)? The beta of the market is taken as 1.0, and thus if the beta of a stock is less than 1.0 its considered less volatile than the market and if it is greater than 1.0 then its considered more volatile than the market. Please explain further, you say. What this means is that stocks that are more volatile than the market will experience more severe up and down price fluctuations in response to market’s up and down fluctuations respectively. Thus, a stock with beta less than 1.0, will as you guessed experience less price fluctuations in relation to the market’s up and down fluctuations. Thus, low beta (less than 1.0) stocks are considered more stable, more safe, and should be part of your portfolio. More in Types of Risk.
- PE Ratio (TTM): The Price to Earnings (PE) ratio = price of share / annual earnings per share. TTM = trailing twelve months, which means that the earnings used for calculating this PE ratio are the last 12 months’ Earnings Per Share (EPS) of the company. The PE ratio is used to see if the company’s share price is cheap or expensive relative to its industry, and relative to the market. Read here for more on the PE ratio.
- EPS (TTM): Earnings Per Share is annual earnings per share a company has made. TTM = trailing twelve months.
- Forward Dividend & Yield: The forward dividend is the annualized estimation of the expected per share dividend that the company will pay to its shareholders. Dividend yield is the amount of dividend that is expected expressed as a percentage of the current price. Thus, let’s take the example of HUL above to understand this:
- HUL share price = INR 1780.10
- HUL forward dividend = INR 20.00
- HUL dividend yield = (INR 20 / INR 1780.10)*100 = 1.13% ( which is 1.1235 rounded up to 1.13).
- Payout ratio: this is the percentage of earnings that are paid out to shareholders as dividends. This is not listed in the above screenshots I have posted of AMZN, HUL, and RY, but is an important metric to know. A payout ratio of less than 50% is considered good and safe. Good because the company is paying out 50% of its earnings to you as dividends. Safe because even in case of an economic or business downturn, chances are the company can continue to maintain paying out the dividend at the rate that it has been paying out today. There is one class of companies, called REITs (Real Estate Investment Trusts), which are by law required to payout 90% of their earnings as dividends to shareholders. Non-REIT companies that payout a high percentage of their earnings as dividends may have to cut back the dividend in case of downturns, and thus the dividend from such companies is not considered safe.
- Ex-dividend date: this is the date after which the share will not fetch a dividend that the company has declared for this period (which could be monthly, quarterly, annually, etc.). Thus, if you want to get the current period’s dividend, then you have to be the owner of shares before what is called the Record Date. Record date is the date on which those who are listed as shareholders in the company’s records will be the ones to get the declared dividend for this period.
The above help you determine the qualitative nature of the company that you plan to or would like to invest in. It tells you information like how big is the company (market cap), will it be stable or a volatile company and therefore its stock (beta), how expensive is the company at the current price (PE ratio) compared to other companies in its industry and the overall market, what kind of earnings does it have (EPS), and is it a dividend paying company.
Share Price and Volume Information
The left column provides you all price and volume related information for the day, except for the 52-week range which provides you the lowest price and highest price the share has reached in the past 52 weeks.
- Bid and Ask Prices: The Bid price is what someone is offering to pay for the share, and the Ask price is what someone is willing to sell the share for. When the Bid matches the Ask, a transaction takes place between the buyer (Bid) and the seller (Ask).
- Day’s Range: This tells you the low and high prices of the day. This helps you know what kind of price you can expect to pay today if you want to purchase the share, or the kind of price you can get if you plan to sell your shares today.
- Volume: This is an indication of how actively the stock is being bought and sold today. This, when compared with the Avg. volume, tells you whether the stock is going through exceptionally high or low buying and selling activity today. When there is good news or bad news about a company, its shares can see a spike in trading activity and volume on that day or for the next few days or weeks.
- Avg. volume: This tells you the average daily volume of shares bought and sold.
I would recommend you glance at this information for many companies in different industries to understand some of the qualitative differences between companies within the same industry, and between companies in different industries.
So, compare this information between say Google, Microsoft, and Apple, all of which are technology companies. Or between Johnson & Johnson (J&J) and say Abbott Labs, both of which are medical companies. How about comparing Procter & Gamble (P&G) with Colgate or Clorox, which are all consumer products companies. And then, compare J&J with P&G with Apple to see how similar or dissimilar they are, at least from a financial perspective.
This post turned out longer than I had hoped, but I wanted to make sure I gave a good basic understanding of this information to get you started in earnest.
As always, appreciate any feedback you may have.
Thanks for reading!