
Some additional thoughts on the PE ratio are noted below.
- Interpreting the PE Ratio in two ways:
- Price paid: Historical PE of the market has been around 16. Which means that historically on average, for every 1 dollar of earnings (EPS), the market has been willing to pay 16 dollars in price.
- Years to recover price paid: Or, the other way of looking at that is that it will take 16 years to get back what you’re paying for the share today. How is that, you say? Let’s see. The company earns $ 1 per year in earnings. The price per share you’re paying today is $ 16. The number of years it will take to earn what you are paying for the share today = $ 16 / $ 1 per year = 16 years, which is what the PE ratio of 16 is telling you.
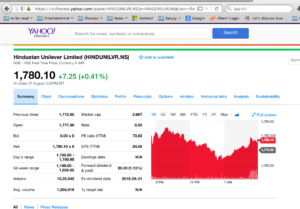
- Lets take a real example with HUL below.
- The Price of HUL is INR 1,780.10. The EPS (TTM) of HUL is INR 24.08. Thus the PE of HUL is INR 1,780.10 / INR 24.08 = 73.924, which has been rounded up to PE ratio of 73.93 here.
- This is telling you that people are willing to pay INR 73.93 for every INR 1 of earnings HUL has , or that people are willing to wait 73.93 years for the company to earn the money that you’re paying for its share today. Remember, if the company pays out 50% of its earnings as dividend, i.e. has a Payout Ratio = 50%, then you will be waiting 73.93 * 2 = 147.86 years to get back the price you paid in the form of dividends!
- Historical Average PE of the US Stock Market: The average US equity PE ratio from 1900 to 2005 has been 14 (or 16, depending on whether the geometric or arithmetic mean, respectively, is used to average. ref. P/E ratio on Wikipedia).
- The current S&P 500 PE Ratio is 25.13 (at 3:45 PM EDT, Fri Aug 31, 2018 at market close).
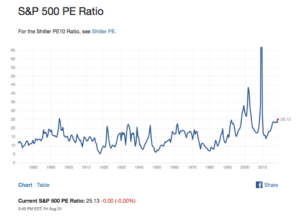 This implies that the market is expensive as compared to the historical PE of the market.
- Growth vs. Value Company
- A growth company generally has a higher PE than the market PE, which indicates that it will grow faster than the overall market growth in terms of revenues and hopefully earnings. Companies like Facebook, Google, Nvidia, Apple, Netflix, Amazon are considered growth companies, and hence generally their PEs are higher than the market PE or the PE ratio of the S&P 500 Index.
- A value company generally has a PE lower than the market, which indicates that the company is undervalued compared to its potential. Companies that get beaten down due to some news or perception of negative news, like AMD (the chip maker) was a few years back, could be considered a value company at that time. AMD has renewed itself and has come back in the last couple of years. On Dec 6th, 2013 AMD shares were trading at US$ 3.66 per share, and on Aug 31st, 2018 they closed at US$ 25.17 per share. Thats a CAGR of 61.94% over 4 years! I wish I had the courage, foresight, and faith in AMD’s ability to comeback in 2013 and bought some shares :). Of course, visibility into what AMD was going to do to come back was not there, and thus many an investor did not invest.
PEG Ratio: The PE Ratio is considered incomplete in that it does not consider the growth of the company. The P/E to Growth or the PEG ratio is considered more complete given that it takes into consideration the growth of the company. But, for now, let’s leave the PEG ratio discussion for another blog post.
As always, I appreciate any feedback you may have.
Thanks for reading!